[ Home Page ] [ Site Map ]
Fluorescence In Situ Hybridisation (FISH) and Comparative Genomic Hybridisation (CGH)
Fluorescence In Situ Hybridisation (FISH)
In situ hybridisation is a technique to directly identify a specific region of DNA or RNA in a cell. Complementary probes linked to molecules such as biotin or fluorescein can be used to visualise the target, which can be chromosomes, interphase nuclei or tissue biopsy.
Advantages and Disadvantages of FISH Techniques
- Direct in situ technique is relatively rapid and sensitive.
- No cell culture needed.
- Result easier to interpret than karyotype.
- Can combine FISH with immunostaining ie FICTION
- FISH will only provide information about the probe being tested, other aberrations will not be detected.
 |
Illustration of FISH technique in metaphase and interphase cells. Normal interphase cells show 2 green spots (BCL-1) and 2 red spots (IgH). Abnormal interphase cells show 3 green spots and 2 red spots, but there must be co-localisation of 1 red and 1 green spot. |
Overview of FISH Technique
- Interphase cells are obtained directly from:
- blood
- bone marrow
- lymph node biopsy
- CSF
- pleural effusions
- interphase nuclei can be extracted from paraffin-embedded tissue.
- Prepare cytocentrifuge slides or use smears. Samples are ready for use immediately, or can be stored at RT prior to use
- Fix cytospins or smears in analar grade methanol
- Pre-treat in 2x saline sodium citrate (SSC) buffer
- Dehydrate in ethanol series
- Denature in formamide & SSC solution
- Dehydrate
- Hybridise for 1 to 72 hours (depending on probe)
- Post hybridisation wash in low salt solution
- Detection of hapten by avidin-FITC or anti-digoxygenin rhodamine
- Wash in PBS solution
- Visualisation using fluorescent microscope
Many probes take less than 1 working day.
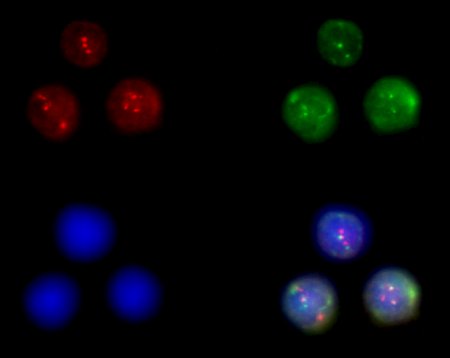
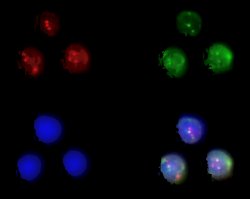 Example of t(11;14)(q13;q32) translocation in bone marrow aspirate of mantle cell lymphoma. Cosmid probes for bcl-1 (11q13) are digoxygenin-labelled and detected with anti-digoxygenin rhodamine. The cosmid probe for IgH (14q32) is labelled with biotin and detected with avidin-FITC. Upper left: rhodamine; upper right: FITC; lower left: DAPI; lower right: composite 3-colour image.
Example of t(11;14)(q13;q32) translocation (arrowed) in interphase nucleus extracted from processed paraffin-embedded lymph node biopsy of mantle cell lymphoma. Cosmid probes for bcl-1 (11q13) are labelled with biotin and detected with avidin-FITC. The cosmid probe for IgH (14q32) is digoxygenin-labelled and detected with anti-digoxygenin rhodamine. The second red signal not visible (out of focal plane).

Comparative Genomic Hybridisation
Comparative genomic hybridisation (CGH) is a competitive FISH assay that can potentially demonstrate all regions of amplification and deletion in the genome. CGH does not require prior knowledge of genetic aberrations, and does not require cells in metaphase.
Advantages and Disadvantages of CGH
- Allows analysis of the total genome in a single experiment.
- Does not require metaphases from the tumour cells of interest.
- Can be carried out on small numbers of purified cells.
- Small amount of DNA required (200-500ng) therefore CGH is applicable to archived material.
- Cannot detect balanced translocations
- Contaminating normal cells reduce the sensitivity, at least 50% tumour cells needed. Sensitivity for small amplifications and deletions is poor.
- Technically demanding and labour intensive.
Overview of CGH Technique
- DNA extracted from normal and tumour samples using standard phenol/chloroform technique.
- Nick translation technique is used to directly label DNA with SpectrumRed (normal) and SpectrumGreen (tumour) fluorescent dyes.
- 200ng of red-labelled normal DNA and green-labelled tumour DNA are mixed together in an excess of unlabelled Cot-1 DNA, and dissolved in formamide solution.
- Labelled DNA and normal metaphase slides are combined and denatured at 75°C for 5 minutes, then hybridised for 72 hours at 37°C, washed and DAPI stained.
- Sequential colour images are taken by image capture using camera attached to fluorescent microscope fitted with narrow band-pass filters for fluorescein (green), rhodamine (red) and DAPI (blue).
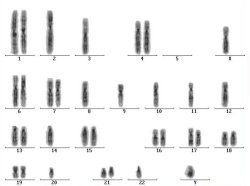
- Inverted DAPI-banded chromosomes are karyotyped and ratios of green to red fluorescence are determined using image analysis software.
- DNA sequences that are over-represented in the tumour show a high green to red ratio i.e. amplifications
- DNA sequences that are under-represented in the tumour show a low green to red ratio i.e. deletions
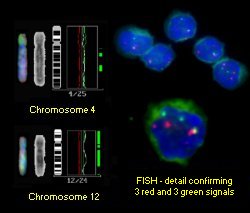 |
Example of final composite CGH result for case of atypical B-CLL showing interphase FISH result: alpha satelite 4 is red, alpha satelite 12 is green. |
Examples of CGH in Practice
 |
 |
Ideograms showing red and green fluorescence ratios. The upper limit (fine green lines) is set at 1.25, and the lower limit (fine red lines) is set at 0.80. Left-hand ideogram shows green-labelled male DNA and red-labelled female DNA from normal donors. Right-hand ideogram shows green-labelled MPE600 (breast cancer) cell-line DNA.
Green bars to the right of each individual chromosome graph indicate chromosome gains.
Red bars to the left of each graph indicate chromosome losses.
MPE600 shows gain of chromosomes 1q and 7, and loss of 11q, 16q and 17p. |
[ Home Page ] [ Site Map ]
This page was last modified on:
21 September 1999
Comments & Feedback to: [email protected]
Copyright © HMDS, 1999
[URL: www.hmds.org.uk/fish_cgh.shtml]